Biology (SJCR)
Stechnolock Journal of Case Reports
Full Text
Volume 1, Issue 1
Study of Efficacy for Low Carbohydrate Diet (LCD) and Homeostasis Model Assessment (HOMA) in Diabetes
*Corresponding Author: Hiroshi Bando, Department of Medical Research, Tokushima University/Medical Research, Nakashowa 1-61, Tokushima 770-0943, Japan, Tel: +81-90-3187-2485; E-mail: pianomed@bronze.ocn.ne.jp
Received Date: August 15, 2018 Accepted Date: December 22, 2018 Published Date: December 26, 2018
doi: /sjcr.2018.1.101
Citation: Bando H, Ebe K, Muneta T, Bando M, Yonei Y (2019) Study of Efficacy for Low Carbohydrate Diet (LCD) and Homeostasis Model Assessment (HOMA) in Diabetes. Stechnolock J Case Rep 1: 1-7.
Copyright: © 2018 Hiroshi Bando. This is an open-access article distributed under the terms of Creative Commons Attribution License, which permits unrestricted use, distribution, and reproduction in any medium, provided the original author and source are credited.
Abstract
Background: Discussion of Low Carbohydrate Diet (LCD) and Calorie Restriction (CR) has been continued. Authors have reported research about LCD, CR and Morbus (M) value. In current study, homeostasis model assessment (HOMA) was also investigated together, with the purpose of study for insulin resistance and secretory ability.
Subjects and Methods: Subjects were 56 type 2 diabetes mellitus (T2DM) patients with fasting immunoreacitve insulin (IRI) in 5-10 μU/mL. Methods included basal tests, glucose, IRI, HOMA-R, HOMA-β, daily profile of glucose on day 2 and 14 during LCD meal.
Results: The obtained data were as follows: average age 63.1 ± 10.5 yo., average HbA1c 7.9 ± 1.9%. Median values are fasting glucose 150 mg/dL, HOMA-R 2.6, HOMA-β 25.9. Divided into 4 groups due to M value, HOMA-R and HOMA-β in each group were 2.3, 2.6, 2.2, 3.5, and 46.1, 40.7, 24.3, 15.9, respectively. Median values on day 2 vs. 14 were: average blood glucose 181mg/dL vs. 139mg/dL, M value 60.7 vs. 10.2, triglyceride 129 mg/dL vs. 89.5 mg/dL. The level of M value showed significant correlation to average glucose, M value, and HOMA-β (p<0.01).
Discussion and Conclusion: The results suggested that patients have insulin resistance and decreased β cell function, LCD would have effects for improving glucose variability, and data would be useful and beneficial for future research.
Keywords: Morbus value; Type 2 diabetes mellitus; Low carbohydrate diet; Daily profile of blood glucose; Homeostasis model assessment of insulin resistance; Homeostasis model assessment of β cell function
Abbreviations: T2DM: Type 2 Diabetes Mellitus; M value: Morbus Value; IRI: Imuuno Reactive Insulin; HOMA-R: Homeostasis Model Assessment of Insulin Resistance; HOMA-β: Homeostasis Model Assessment of Β Cell Function; MBSBS: M value in each BS of | 10 × log BS/120 |3; LCD: Low Carbohydrate Diet
Introduction
Diabetes has been increasing in a lot of countries for long, and the number of the patients has reached to 425 million by WHO [1]. It is not only associated with medical problems, but also social and economic problems worldwide. Diabetes contains mac- rovascular complications of brain, heart, lower extremities and microvascular complications such as neuropathy, retinopathy and nephropathy.
As to these diabetic complications, there has been increasing evidence that persisting elevated blood glucose may be responsible for pathological changes [2,3]. Impaired microcirculation would be involved in the etiology of diabetic changes [4]. Regarding the microvascular complications, there seems to be four possible mechanisms influencing the biochemical changes. They are forma- tion of advanced glycation endproducts (AGEs), increased flux of glucose and other sugars through the polyol pathway, activation of protein kinase C (PKC) isoforms and increased flux through the hexosamine pathway [5].
From mentioned above, appropriate measures are crucial to address the problems related to diabetes [6]. As to nutritional therapy of diabetes, Atkins et al. initiated Low Carbohydrate Diet (LCD) [7]. The effect for lowering blood glucose and reducing weight has been recognized broadly. After that, Dietary Intervention Randomized Controlled Trial (DIRECT) Group reported the comparison of effects among low-carbohydrate, Mediterranean and low-fat diet [8,9]. In this case, Low-Fat Diet equals to Calorie Restriction (CR). This brought the discussion about LCD and CR for years [9,10].
On the other hand, authors introduced and developed LCD by seminars in Japan, presenting medical society and medical papers [11,12]. We have also reported clinical study of elevated Ketone Bodies (KB) and its physiological role in the axis of fetus, placenta, newborn and mother [13]. Moreover, we have continued clinical diabetic research concerning LCD and CR [14]. Our recommended three types of LCD have been widely used for patients with type 2 diabetes (T2DM) and obese subjects, including super LCD, mod- erate LCD and petite LCD meals [15].
In this study, we investigated the glucose variability on CR diet by daily profile of blood glucose and M value in patients with T2DM. We also studied clinical effects of LCD for 2 weeks by decreasing blood glucose and M value. Furthermore, we analyzed the rela- tionship among these associated with homeostasis model assessment of insulin resistance (HOMA-R) and homeostasis model as- sessment of β cell function (HOMA-β). The purpose of investigating HOMA-R and HOMA-β would be the study for insulin resistance and secretory ability from pancreas.
Subjects and Methods
In this study, enrolled subjects were 56 patients with T2DM. They were admitted to the hospital for detail evaluation and adequate treatment of T2DM. The subjects were selected by a criterion. Out of many diabetic patients studied, current subjects have the level of immunoreactive insulin (IRI) more than 5 μU/mL, 10 μU/mL and less than 10μU/mL in the fasting morning after overnight fast. The subjects with less than 5 μU/mL, 5 μU/mL and more than 10 μU/mL were excluded in this study.
Regarding the methods, we have had a certain protocol of diabetic evaluation and treatment in our clinical investigation. In current study, the following series of approach were performed.
- The patients were admitted to the hospital. In the morning of day 2, blood samples were drawn after overnight fasting. The examination included fundamental tests such as lipids, liver and renal function, complete blood count and diabetes related bio- markers. As to diabetes, glucose, HbA1c, IRI, C-peptide, HOMA-R, HOMA-β and M value were measured and calculated.
- We have made up our diabetic protocol with CR and LCD. As to nutritional therapy, subjects have CR on day 1 and 2, in which the content has protein 15%, fat 25% and carbohydrate 60% with 1400 kcal/day. This ratio is from the standard of the macronutrients recommended by Japan Diabetes Association [16].
- Subjects have LCD from day 3 to 14 with super LCD meal. The content has 12% of carbohydrate with 1400 kcal/day. We have other two formula, which are standard LCD with carbohydrate 26% and petite LCD with carbohydrate 40%.
- Several biomarkers were studied in Day 2 and Day 14. In each day, blood samples were drawn in the morning after overnight fasting. Both data were compared in order to investigate the efficacy of LCD during 12 days.
Daily Profile of Blood Glucose
As regard to glucose metabolism, daily profile of blood glucose was studied on day 2 and on day 14. In each day, blood glucose levels were measured 7 times a day and clock times were 08, 10, 12, 14, 17, 19 and 22h. Blood glucose was measured using the Glu test Mint by SKK Sanwa Co. Ltd., Nagoya, Japan. In relation to glucose, HbA1c was measured using the Accu-Chek Aviva Nano (Roche) by Roche Diagnostics, Tokyo, Japan.
After obtaining the data of blood glucose, average blood glucose a day and also the level of Morbus value (M value) were calcu- lated according to the formula equation [17,18].
Morbus value
M value is the biomarker expressing the variability of blood glucose. It indicates two important factors. One is the average blood glucose level in a day, and another is the mean amplitude of glycemic excursions (MAGE) [17-19]. Consequently, M value is a nu- merical value, which means the degree of high blood glucose and the fluctuation of blood glucose. From the mathematical point of view, it is calculated by the logarithmic transformation. The significance of M value means the degree of glucose deviation from the ideal glucose variability [18-20].
M value has three steps for calculation. At first, M=MBS + MW: M value means the total of MBS and MW. In addition, MW means maximum blood glucose − minimum glucose)/20. Further, MBS is the mean of MBSBS. MBSBS is a numerical number for evaluating glucose variability. It is calculated as the absolute value of [10 × log (blood glucose level/120)])3 , which formula is the M value in each BS of | 10 × log BS/120 |3 [18-20].
As to the normal value of M value, the following would be the standard judgment. Clinically, the level of M value would be that it is normal less than 180 is normal range, borderline is from 180 to 320, and abnormal range is more than 320.
Statistical Analysis
As regard to this study, obtained data were shown by mean and standard deviation. In addition, data was described as the median and quartile of 25%/75% according to the necessity of the biomarkers. Boxplot was used for the comparison among some groups, which expresses the median and the quartile of 25%/75%, maximum and minimum. As to investigation for the correlation with biomarkers, we used Spearman test to obtain the correlation coefficients. We utilized JMP (Version 8) statistical analysis software (JMP Japan Division of SAS Institute Japan Ltd.) and Microsoft Excel analytical tool [21].
Ethical Considerations
Current research was conducted in compliance with the ethical principles based upon the Declaration of Helsinki. Moreover, ad- ditional commentary was performed in the Ethical Guidelines for Medical Research in Humans and in accordance with the Good Clinical Practice (GCP), with ongoing consideration to the protection of subjects’ human rights. Furthermore, there was the “Ethical Guidelines for Epidemiology Research” by the Ministry of Education, Culture, Sports, Science and Technology and the Ministry of Health, Labor and Welfare.
Authors have set up an ethical committee, in which physician, nurse, pharmacist and other experts in the legal specialty are at- tended in discussion. For this study, we discussed and confirmed that thisconsents and written paper agreements have been taken from the subjects. This study has been registered by National University
Hospital Council of Japan (ID: #R000031211).
Results
Fundamental Data
Enrolled subjects (n=56) showed the fundamental data (Table 1). Average age was 63.1 years old with 64 years old in median value. Average or median value of HbA1c and IRI was 7.9% or 7.3% and 7.0 μU/mL or 7.3μU/mL, respectively. Median value of HOMA-R and HOMA-β were 2.63 and 25.9, respectively.
Changes in Biomarkers
The changes in biomarkers between day 2 and day 14 were compared as the effect of LCD for 12 days (Table 2). There were de- creased median values of day 2 vs. day 12 in average glucose, M value and triglyceride, which were 181 vs. 139 mg/dL, 60.7 vs. 10.2 and 128 vs. 89.5 mg/dL, respectively.
As for the values of average glucose, M value and triglyceride, there were significant difference between day 2 and day 14 (p<0.05) by the statistical investigation using non-parametric tests.
Correlations of M Value
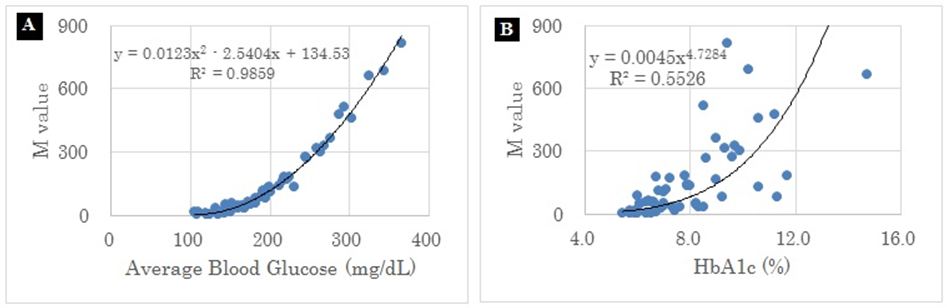
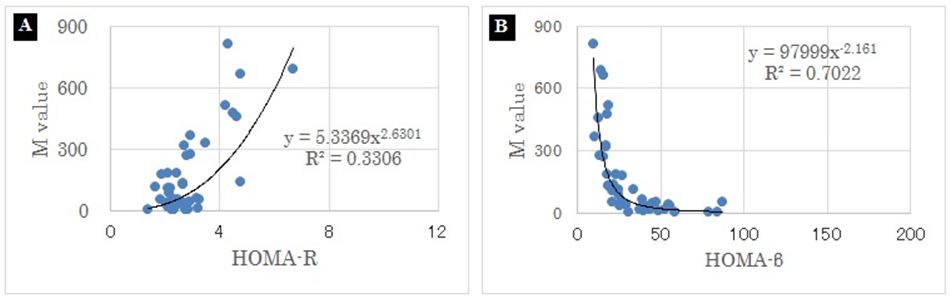
There were significant correlations between M value and also average glucose (p<0.01) and also between M value and HbA1c (p<0.01) (Figure 1). Furthermore, there were significant correlations between M value and HOMA-R (p<0.01) and also between M value and HOMA-β (p<0.01) (Figure 2).
Categorization by M Value
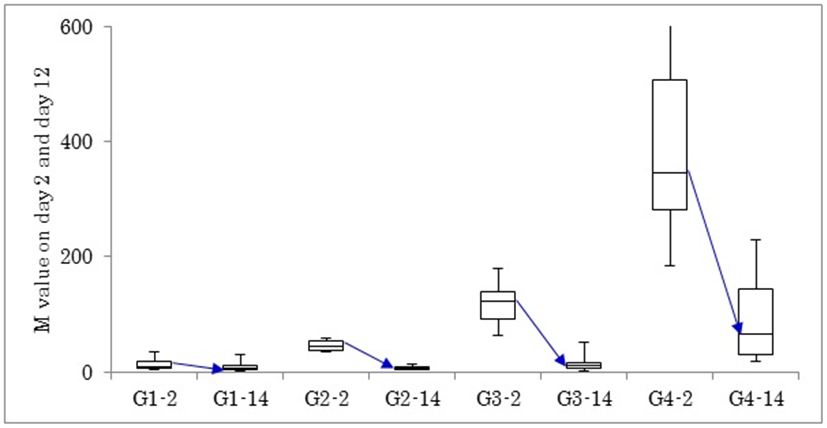
Fifty-six subjects were divided into 4 groups according to the level of M value. Each group has 14 cases, and each group showed the median of M value as 9.5, 44.8, 123 and 346, respectively. The level of M value was remarkably elevated in group 1.
Comparison of Biomarkers in 4 Groups
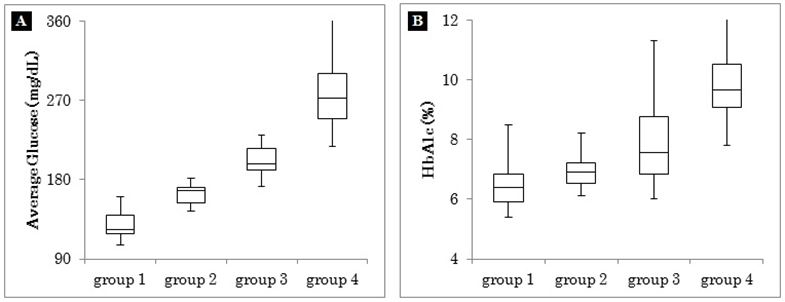
Median values of blood glucose in 4 groups are 123 mg/dL, 167 mg/dL, 198 mg/dL and 272 mg/dL, respectively (Figure 3A). Me- dian HbA1c values of 4 groups are 6.4%, 6.9%, 7.6%, and 9.7%, respectively (Figure 3B).
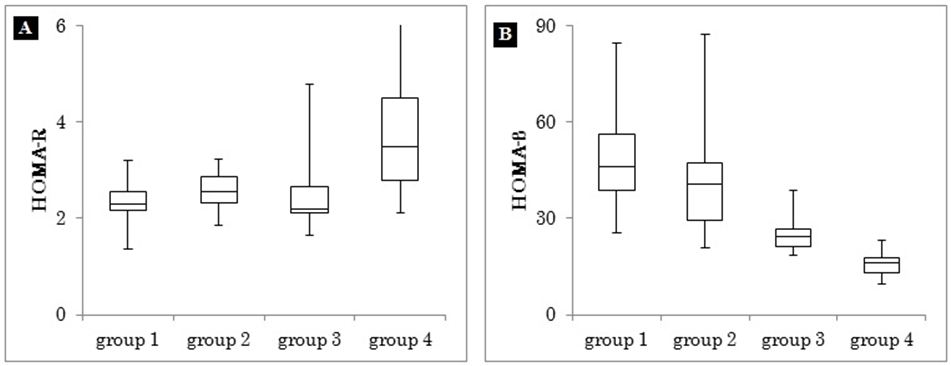
Regarding HOMA-R and HOMA-β, the value of each group was calculated. Median values of HOMA-R in 4 groups are 2.3, 2.6, 2.2 and 3.5, respectively (Figure 4A). Median values of HOMA-β in 4 groups are 46.1, 40.7, 24.3 and 15.9, respectively (Figure 4B). The level of HOMA-β decreased from group 1 to 4.
Correlation between M Value and HOMA
The changes in M value between day 2 and day 14 are shown in Figure 5. In 4 groups, the M value decreased from day 2 to day 14. The degree of decrease showed larger in the order of group 1 to 4.
Discussion
In recent years, therapeutic procedure for diabetes has been in focus from various points of view. Some management principle and way for diabetes have been proposed by International Diabetes Federation (IDF), American Diabetes Association (ADA) and American College of Physicians (ACP) [22-24]. One of the controversy points was found concerning the recommended HbA1c in some situations. Consequently, adequate control of glucose variability would be crucial and on discussion [25].
In this study, we examined T2DM cases with fasting IRI greater than 5, 10 and less than 10. As a comparative study, we have our unpublished data, in which IRI was 5 or less. Comparing the ranges of numerical values between our data vs. this report, 0-3 vs. 0-7 for HOMA-R and 0-50 vs. 0-90 for HOMA-β. Regarding the correlation with other factors, the distributions of both are rather overlapped in various biomarkers, and obvious differences between the both were not clarified at the moment. However, these results seem to be the basic data in this area for future study.
The average blood glucose level, HbA1c level and TG level decreased with short term of LCD meal. Especially, in Group 4 with high average blood sugar and M value, the reduced degree was to large extent. It has been known that LCD lowers TG level in short term of the LCD [26]. On the other hand, HDL reveals a slight upward trend after several months, while LDL does not show constant direction, which is descending, rising or stable depending on each case [26].
One of the important factors in this study is M value. It is a useful biomarker due to its numerical value indicating both of mean blood glucose and MAGE [17-20]. Further, average glucose can be measured from blood sampling 7 times a day. According to the previous related reports, the results of the comparison between sampling 7 times and 20 times are almost the same [17,27]. Then, both would have compatible data, as well as the results from continuous glucose monitoring (CGM) [27,28].
The correlation coefficient between M value and the mean blood sugar showed extremely high. The reason would be that the calculation method of the M value is using the quadratic equation including the average blood sugar. Regarding the correlation between M value and HbA1c, the dispersion was small when A1c was from 4% to 8%, but the variation was large from 9% to 12% and the reason would be that HbA1c indicates the average of blood glucose levels in recent 1-2 months. In contrast, M value could be widely distributed, because the average and fluctuation of blood glucose is calculated on that day.
As the result, M value and the HOMA-R had a positive correlation, while M value and the HOMA-β had a negative correlation. Among them, the correlation coefficient was higher in HOMA-β. The reason would be that M value includes mean blood glucose and MAGE with close relationship with insulin secretion, and that HOMA-β represents pancreas function.
HOMA has been used as the useful biomarker for diabetes, where fasting blood sugar and fasting insulin were taken into consid- eration at the time of HOMA calculation. In original, HOMA was initiated by Matthews who is mathematician [29]. HOMA is based on the balance between hepatic glucose output and insulin secretion from fasting levels of glucose and insulin [30].
As to clinical significance and implications of HOMA, functions of both ability to secrete insulin and resistance of insulin have been inferred. There are two formulas of HOMA, including HOMA-R and HOMA-β. When the level of HOMA-R elevates, the insulin re- sistance would be elevated. Concerning the standard value of HOMA-R, 1.73 or more indicates the existence of insulin resistance [31]. In the case of current study, data showed HOMA-R more than 1.73, because all cases had fasting IRI more than 5 μU/mL.
On the other hand, HOMA-β has been known as ability for secreting insulin. The standard value would be 100% in western people, and about 70% in Asian people [32].
From mentioned above, high HOMA-R and low HOMA-β were independently and consistently associated with an increased dia- betes risk [33]. Compared the obtained data of HOMA-R and HOMA-β, most subjects in this study did not show normal ranges, suggesting the existence of insulin resistance and decreased β-function.
When dividing the subjects into several groups for further research, there are some options depending on which biomarker is used. The possible biomarkers can be raised such as fasting blood glucose level, HbA1c, average blood glucose level, M value and so on. Among them, from the point of glucose variability, we adopted M value and divided into 4 groups.
The authors have continued various studies concerning CR and LCD so far [12]. When we use fasting blood glucose as dividing biomarker, their levels have overlapped between normal, mild DM and moderate DM. When using HbA1c indicating average condition in 1-2 months, the correlation between HbA1c and blood variability on that day studied would be a little weak. Mean blood glucose represents glucose variability well on the day of examination, while there is another problem of larger blood glucose fluctuation from postprandial hyperglycemia [33].
On the other hand, M value seems to be beneficial for indicating not only average blood glucose, but also MAGE. Furthermore, the numerical level of the M value ranges very wide, from less than 10 to more than 1000. For this reason, M value would be consid- ered advantageous to be able to utilize research studies for investigating the correlation of related biomarkers.
As to the average blood glucose and HbA1c value in 4 groups, their distribution seemed to be rather divided in the former, and rather overlapped in the latter. The median values of HbA1c in 4 groups were increased from group 1 to group 4.
Furthermore, in 4 groups of HOMA-R and HOMA-β, the distribution showed rather scattered in HOMA-R, and rather divided in HOMA-β. These results would suggest the relationship of M value and HOMA-β indicating insulin secretion function, and the re- search direction of these biomarkers in the future [34].
By LCD treatment, M value in the 4 groups showed a decreasing trend from day 2 to day 14. Among them, in Group 1, the numeri- cal value of M value has not so changed. The reason would be due to the calculation way of M value. It becomes minimum result when blood glucose level is 120 mg/dL. For example, M value increases as blood glucose level decreases from 120 mg/dL to 100 mg/dL.
On the other hand, in groups 2, 3, 4, the higher the M value showed at day 2, the greater M value decreased at day 14. From the above, it can be concluded that marked improvement is observed in the M value, indicating the mean glucose level and MAGE by LCD for 12 days.
Concerning the limit of this study, there are some aspects to be considered. In our several studies, subjects showed wider range of fasting IRI [12,33]. Then, this study included the limited cases with 5-10 μU/mL of IRI. We will plan to investigate diabetic patients with IRI more and less of this level. Obtained results would become fundamental and reference data in the future study. Further- more, other biomarkers would be explored as related to these results. They includes serum and urinary C-peptide, the response of glucose and IRI to standard meal, liver, renal function tests and so on [14,35].
Conclusion
In summary, fifty-six patients with T2DM were investigated in this study. Biomarkers including HbA1c, the daily profile of glucose, average glucose, M value, HOMA-R, HOMA-β, decreased glucose and M value on day 14 were measured and correlations among them were investigated. Obtained results suggest that LCD would be clinically effective for T2DM and there would be relationship among them as to glucose variability. These findings would become fundamental data in this research area, and further study would be expected in the future.
Acknowledgement
Regarding current article, some part of the content was presented at annual congress of Japan Diabetes Society (JDS) Conference, Tokyo, 2018. The authors would like to express gratitude all staffs and patients for the cooperation.
- World Health Organization (2016) Global report on diabetes. WHO, Geneva, Switzerland.
- Ojo O (2016) An overview of diabetes and its complications. Diabetes Res Open J 2: e4-e6.
- Dunning T (2014) Care of people with diabetes: A manual of nursing practice. Wiley Blackwell, New Jersey, USA.
- Tagulchi T, Brownlee M (2003) The biochemical mechanisms of diabetic tissue damage. (3rd Edn.), Blackwell Publishing, New Jersey, USA.
- Williams G, Pickup JC (2004) Handbook of Diabetes. (3rd Edn.) Blackwell Publishing, New Jersey, USA.
- Defronzo RA (2009) Banting Lecture. From the triumvirate to the ominous octet: a new paradigm for the treatment of type 2 diabetes mellitus. Diabetes 58: 773-795.
- Atkins RC (1996) Dr. Atkins' New Carbohydrate Gram Counter.
- Shai I, Schwarzfuchs D, Henkin Y, Shahar DR, Witkow S, et al. (2008) Weight loss with a low-carbohydrate, mediterranean, or low-fat diet. N Engl J Med 359: 229-241.
- Schwarzfuchs D, Golan R, Shai I (2012) Four-year follow-up after two-year dietary interventions. N Engl J Med 367: 1373-1374.
- Meng Y, Bai H, Wang S, Li Z, Wang Q, et al. (2017) Efficacy of low carbohydrate diet for type 2 diabetes mellitus management: A systematic review and meta-analysis of randomized controlled trials.Diabetes Res Clin Pract. 131: 124-131.
- Ebe K, Ebe Y, Yokota S, Matsumoto T, Hashimoto M, et al. (2004) Low Carbohydrate diet (LCD) treated for three cases as diabetic diet therapy. Kyoto Med Assoc J 51: 125-129.
- Bando H, Ebe K, Muneta T, Bando M, Yonei Y (2017) Effect of low carbohydrate diet on type 2 diabetic patients and usefulness of M-value. Diabetes Res Open J 3: 9-16.
- Muneta T, Kawaguchi E, Nagai Y, Matsumoto M, Ebe K, et al. (2016) Ketone body elevation in placenta, umbilical cord, newborn and mother in normal delivery. Glycative Stress Res 3: 133-140.
- Ebe K, Bando H, Yamamoto K, Bando M, Yonei Y (2017) Daily carbohydrate intake correlates with HbA1c in low carbohydrate diet (LCD). J Diabetol 1: 4-9.
- Bando H, Ebe K, Muneta T, Bando M, Yonei Y (2017) Clinical Effect of Low Carbohydrate Diet (LCD): Case Report. Diabetes Case Rep 2: 124.
- Japan Diabetes Association (2013) Diabetes clinical practice guidelines Based on scientific evidence.
- Service FJ, Molnar GD, Rosevear JW, Ackerman E, Gatewood LC, et al. (1970) Mean amplitude of glycemic excursions, a measure of diabetic instability. Diabetes 19: 644-655.
- Moberg E, Kollind M, Lins PE, Adamson U (1993) Estimation of blood-glucose variability in patients with insulin-dependent diabetes mellitus. Scand J Clin Lab Invest. 53: 507-514.
- Schlichtkrull J, Munck O, Jersild M (1965) The M-value, an index of blood sugar control in diabetics. Acta Med Scand 177: 95–102.
- Molnar GD, Taylor WF, Ho MM (1972) Day-to-day variation of continuously monitored glycaemia: A further measure of diabetic instability. Diabetologia 8: 342-348.
- Yanai H (2015) Four step excel statistics. (4th Edn.), Seiun-sha Publishing Co.Ltd, Tokyo.
- http://care.diabetesjournals.org/content/38/Supplement_1/S1
- American College of Physicians. (2017) Clinical Guidelines and Recommendations.
- American Diabetes Association (2018) Pharmacologic approaches to glycemic treatment: Standards of medical care in diabetes-2018. Diabetes Care 41: S73-S85.
- Bando H (2018) Statement for diabetes guideline has been on discussion for future better lives. J Endocrinol Thyroid Res 3: 1-4.
- Feinman RD, Pogozelski WK, Astrup A, Bernstein RK, Fine EJ, et al. (2015) Dietary carbohydrate restriction as the first approach in diabetes management: Critical review and evidence base nutrition. 31: 1-13.
- McDonnell CM, Donath SM, Vidmar SI, Werther GA, Cameron FJ (2005) A novel approach to continuous glucose analysis utilizing glycemic variation. Diabetes Technol Ther 7: 253-263.
- Siegelaar SE, Holleman F, Hoekstra JB, Devries JH (2010) Glucose variability; does it matter? Endocr Rev 31:171–182.
- Mendonça FM, de Sousa FR, Barbosa AL, Martins SC, Araújo RL, et al. (2015) Metabolic syndrome and risk of cancer: Which link? Metabolism. 64: 182-189.
- Wallace TM, Levy JC, Matthews DR (2004) Use and abuse of HOMA modeling. Diabetes Care 27: 1487–1495.
- Song Y, Manson JE, Tinker L, Howard BV, Kuller LH, et al. (2007) Insulin sensitivity and insulin secretion determined by homeostasis model assessment and risk of diabetes in a multiethnic cohort of women: The Women's Health Initiative Observational Study. Diabetes Care 30: 1747-1752.
- Hayashi T, Boyko EJ, Leonetti DL, McNeely MJ, Newell-Morris L, et al. (2003) Visceral adiposity and the risk of impaired glucose tolerance: a prospective study among Japanese Americans. Diabetes Care 26: 650-655.
- Bando H, Ebe K, Muneta T, Bando M, Yonei Y (2018) Study on responses of C-peptide and blood glucose for carbohydrate 70g in diabetes. Endocrinol Metab 2: 110.
- Kahleova H, Tura A, Hill M, Holubkov R, Barnard ND (2018) A plant-based dietary intervention improves beta-cell function and insulin resistance in overweight adults: A 16-week randomized clinical trial. Nutrients 10: 1-11.
- Qu C, Zhou X, Yang G, Li L, Liu H, et al. (2016) The natural logarithm of zinc-α2-glycoprotein/HOMA-IR is a better predictor of insulin sensitivity than the product of triglycerides and glucose and the other lipid ratios. Cytokine 79: 96-102.